15. Model Interpretability with Shapley Values
Model Interpretability with Shapley Values
ND320 AIHCND C01 L04 A12 Model Interpretability With Shapley Values
Model Interpretability Key Points
Note: This section is included largely as a bonus and not required in the project, but it is very good to know about.
Why is Interpretability Important for EHR Datasets?
In general, as you would find for other industries you also want to be aware of biases in your model from key features and be able to identify bugs or issues that might occur.
For example, you might diagnose issues with your model where a feature like inpatient vs outpatient might have a greater weight than expected. This could be due to the nature of the type of problem you are dealing with as there are major distinctions with how inpatient and outpatient claims are handled.
Model interpretability is an issue that is often brought up as being important in fields like healthcare because of the level of scrutiny on many decisions by regulators, the public, and the healthcare community.
People want to understand how key decisions that can seriously impact lives are made and this is where practitioners often tend to use simpler models like linear models as they are easy to interpret. They want to avoid the proverbial Black Box model as it's important to have a clear idea of how a model is getting its predictions.
Black Box: Term often used in software when inputs go in and outputs come out of an algorithm and it is not clear how the outputs were arrived at.
However, these simpler linear models lack the complexity to handle more sophisticated cases that can have a bigger impact on society that deep learning models can potentially handle. That is why we need to use model interpretability to help remove the Black Box from our better, more complicated models.
Model Interpretability Methods
Model Agnostic: methods that can be used on deep learning models or traditional ml models
A few methods we can use for interpreting deep learning models that are also model agnostic include:
- LIME or Local Interpretable Model-Agnostic Explanations
- Can scale to large datasets
- Can be difficult to find the right kernel
- Can have unstable interpretations
- Shapley Values
- A method that measures the marginal contributions of features
- Can be computationally expensive
Shapley Values
Shapley values are based on game theory and provide the marginal contributions of features by taking the permutations of different features and then the differences between the prediction output. You can learn more about these in the links below.
Additional Resources
- Shapley Value Explanation
- Integrated Gradients - method that is specialized for deep learning models
Shapley Value Walkthrough
- Using Open Source Library Shap - https://github.com/slundberg/shap
- The algorithms and visualizations used in this package came primarily out of research in Su-In Lee's lab at the University of Washington, and Microsoft Research.
Steps
- Train model without Tensorflow Probability layers, for this walkthrough we will call it 'shap_model'.
- Use Kmeans clustering to summarize data. As we mentioned earlier the issue with Shapley can be the computation time and a way to reduce this is to cluster the features with Kmeans. In this example, we arbitrarily use 25 clusters but you could use a different number.
df_train_normed_summary = shap.kmeans(normed_train_data.values, 25)- Use Shapley package's model agnostic KernelExplainer class and pass in the Shapley model and the summarized training data that has already been normalized in the previous walkthrough.
explainer = shap.KernelExplainer(shap_model.predict, df_train_normed_summary)- Extract Shapley values from the explainer.
shap_values = explainer.shap_values(normed_train_data.values)- Summarize the Shapley values in a plot.
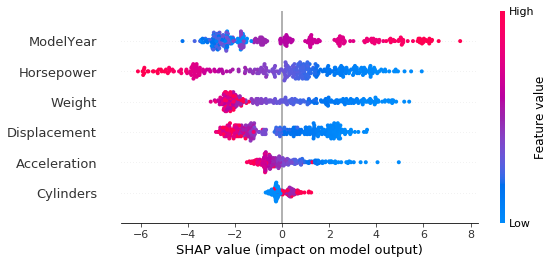
shap.summary_plot(shap_values[0], normed_train_data)Explanation of Feature Importance Visual
- The y-axis shows the feature importance scale from top to bottom. The sorted order of features gives the relative importance ranking of features. So in our case, model year is the most important feature, and this shouldn't be surprising considering MPG standards increase each year.
- Then, on the x-axis, you can see the Shapley values impact on model output. Feature values are either red, which stands for high values or blue which is for low values. Model year has red values that show a positive impact on model output, which in this case higher model year values yield higher MPG value output predictions.
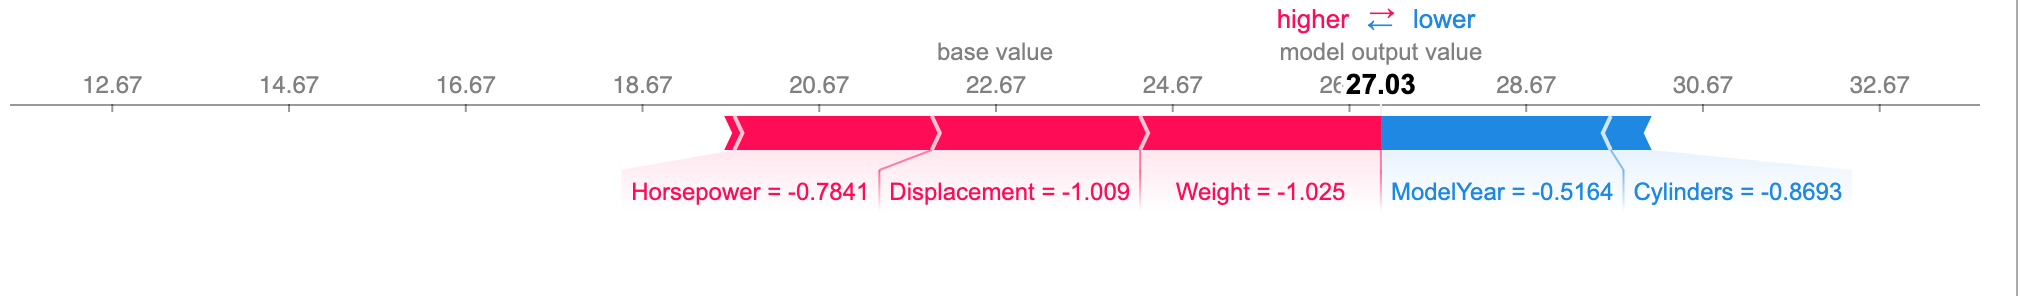
- Single point visualization - Next, we will look at a single point in this visualization. This shows 5 features change the base value towards zero. The base value is the average model output over the training dataset. The features in red displacement, horsepower and weight are pushing the label to a higher value. Whereas model year and cylinder, in this case, are pushing lower.
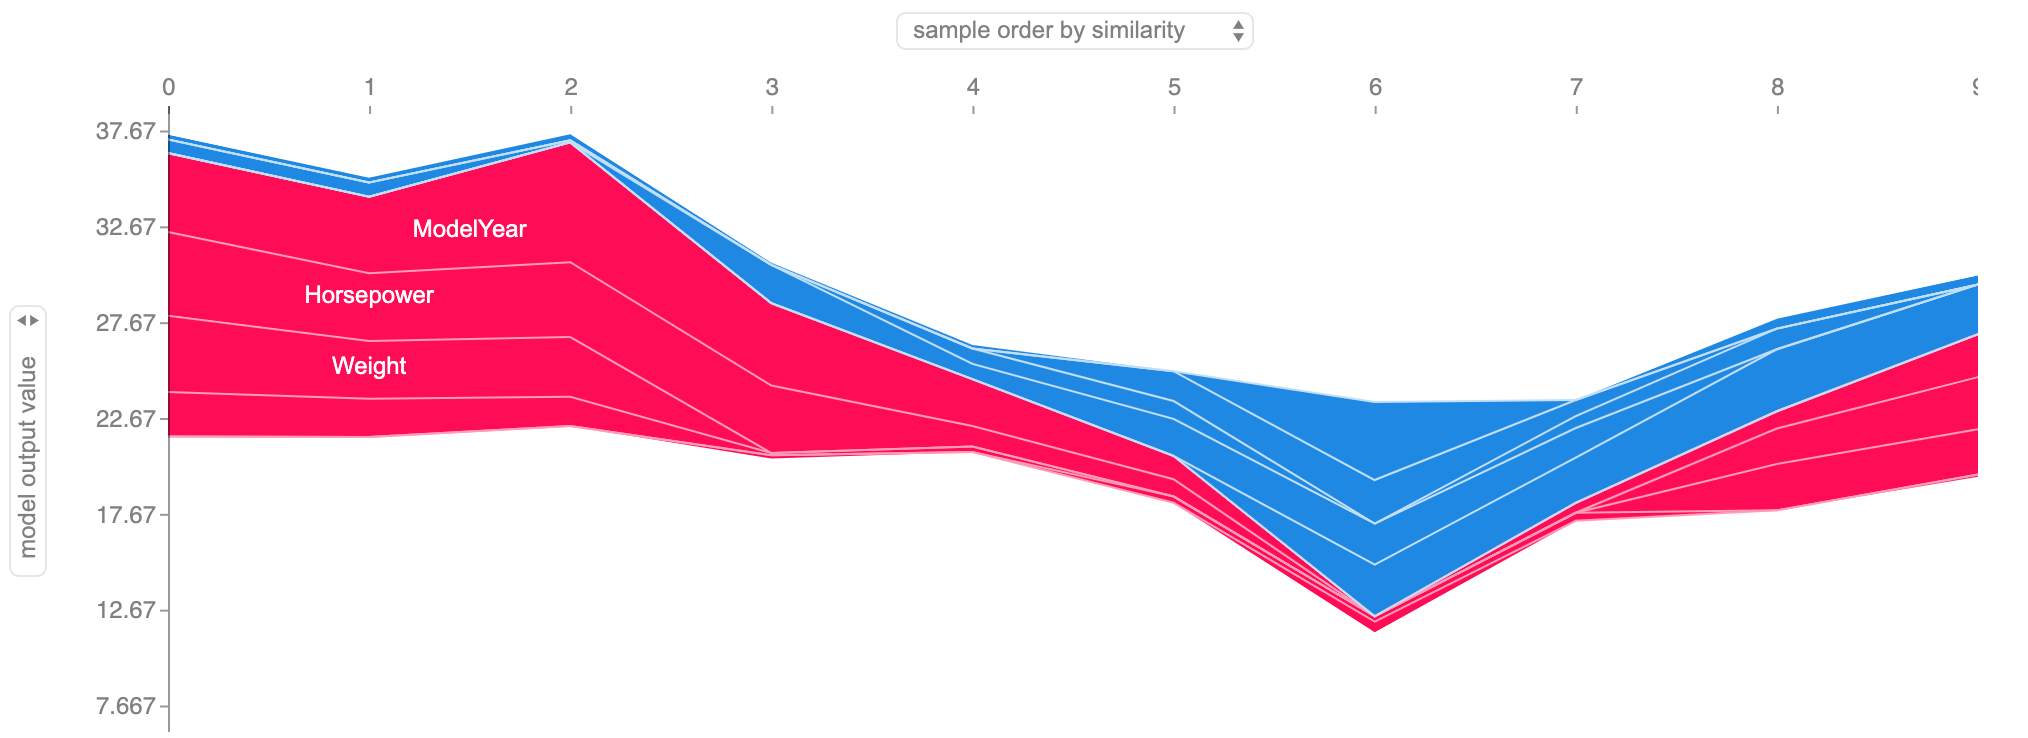
- Larger Sample- Lastly let's take that last visual and expand it to a sample of 10 points. Hopefully, this better illustrates how certain features are pushing the value up or down relative to a base value.
Code
If you need a code on the https://github.com/udacity.
SOLUTION:
LIME can be subject to multiple interpretationsSOLUTION:
- The x axis gives the impact of Shapley values on model output.
- The y axis is the ranked list of features.